The Chesapeake Bay jellyfish map for today
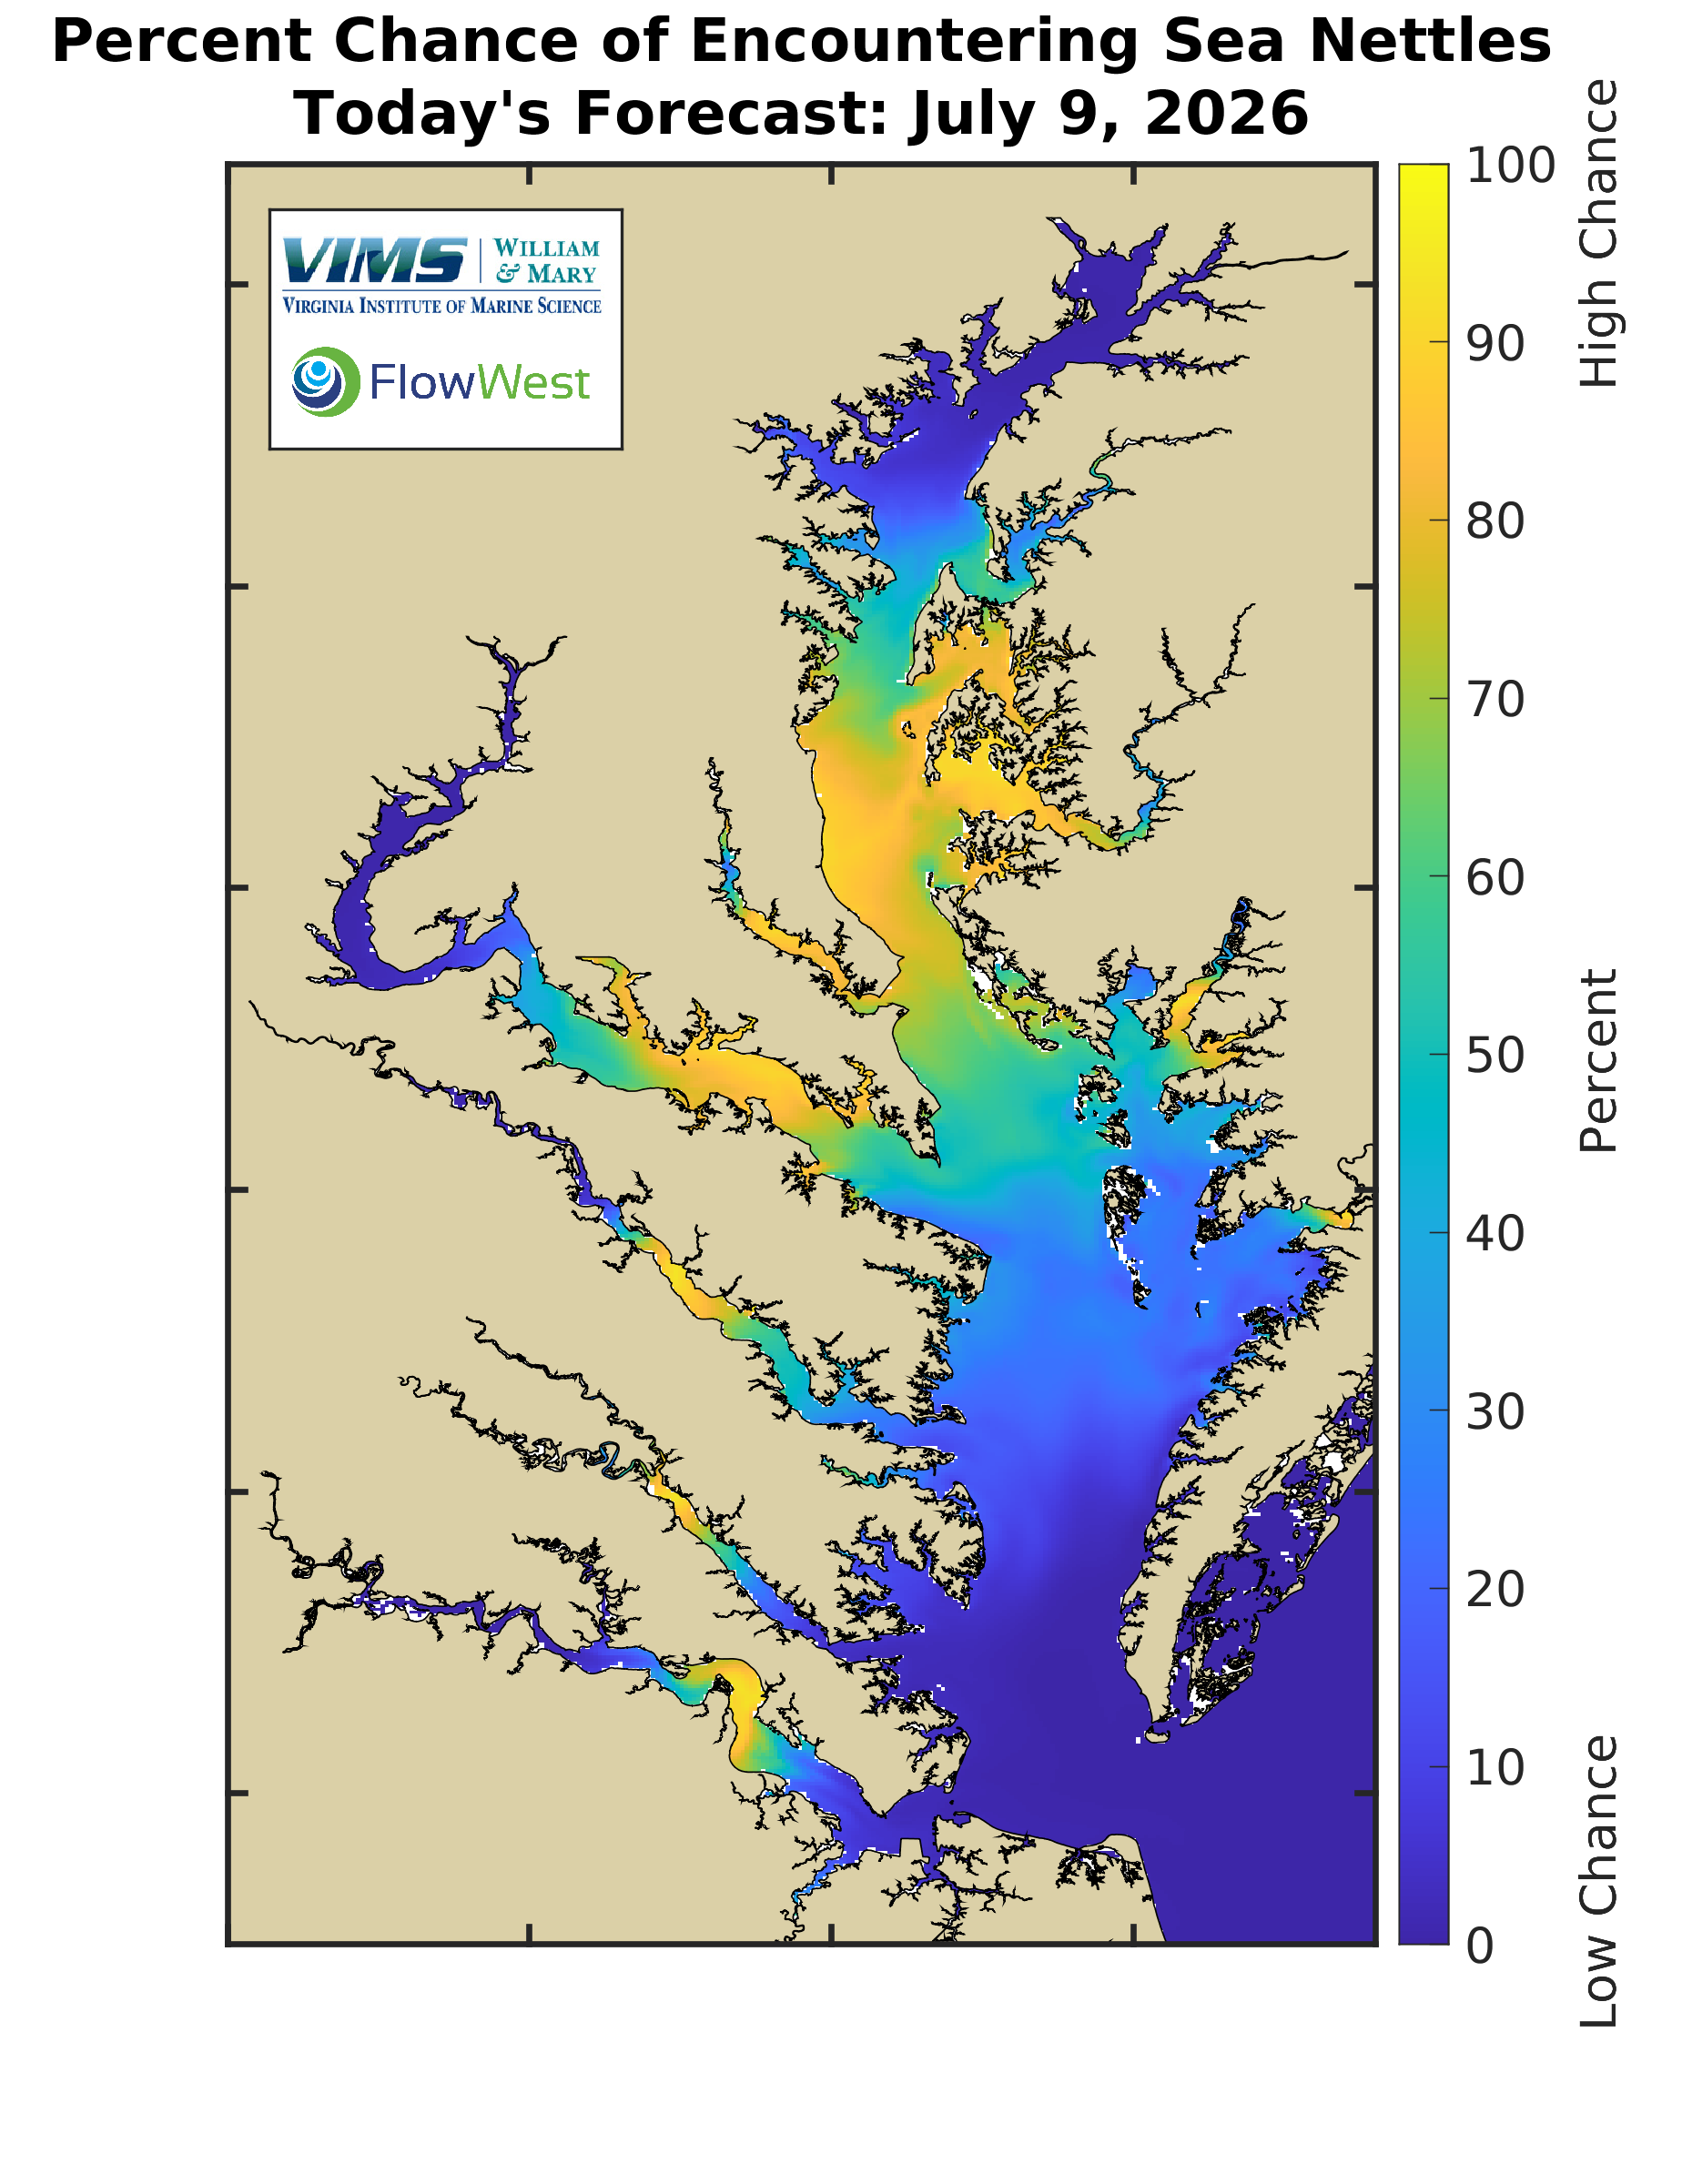
This is the live sea nettle forecast for the Chesapeake Bay. Sea nettles are the stinging jellyfish most people mean when they ask about the bay in summer. The map below is today's forecast from the Virginia Institute of Marine Science, or VIMS. It refreshes every morning, so what you see here is today's picture, not an old snapshot. Warmer, saltier water is where nettles are most likely, and the map shades those areas so you can spot them fast.
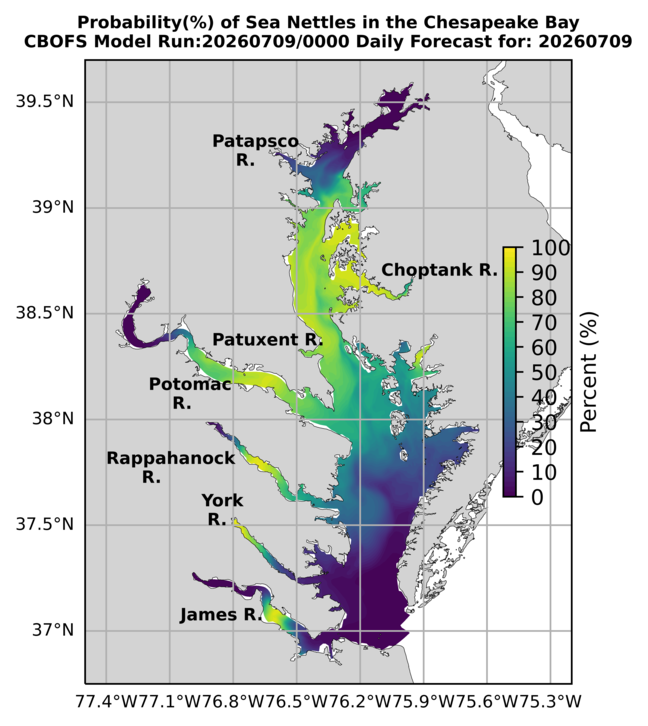
Here is the same day from a second source, the NOAA NCCOS Chesapeake Bay sea nettle forecast. It covers the full bay and can look a little different from the VIMS map because the two models are built in slightly different ways. When both maps agree that an area is high, that is a strong signal. When they disagree, treat the water as uncertain and check your exact beach.
How to read the Chesapeake Bay jellyfish map
The colors are the whole story. These maps do not count jellyfish. They show a modeled percent chance of running into sea nettles, based mainly on water temperature and how salty the water is. Think of it as a likelihood, not a headcount.
The color scale below is the key. Blue means a low chance. As the chance rises, the colors move toward yellow and warmer shades, which mean a high chance. So a blue river mouth is a good sign, and a yellow patch near a beach is a reason to pause.

A few things help when you read either map. Look at the water right next to your beach, not the bay as a whole. Salt drives the pattern, so the lower, saltier bay and the mouths of the big rivers tend to light up first and stay active longest, while fresher water far up the rivers usually stays calmer. And remember the shading can shift day to day as heat and rain change the water.
Tomorrow's Chesapeake Bay jellyfish forecast
Both models also publish a next-day outlook. Tomorrow's maps are useful when you are planning a beach day ahead of time. They use the same colors, so blue is still low and yellow is still high. Here is tomorrow's VIMS map first, then tomorrow's NOAA bay map.
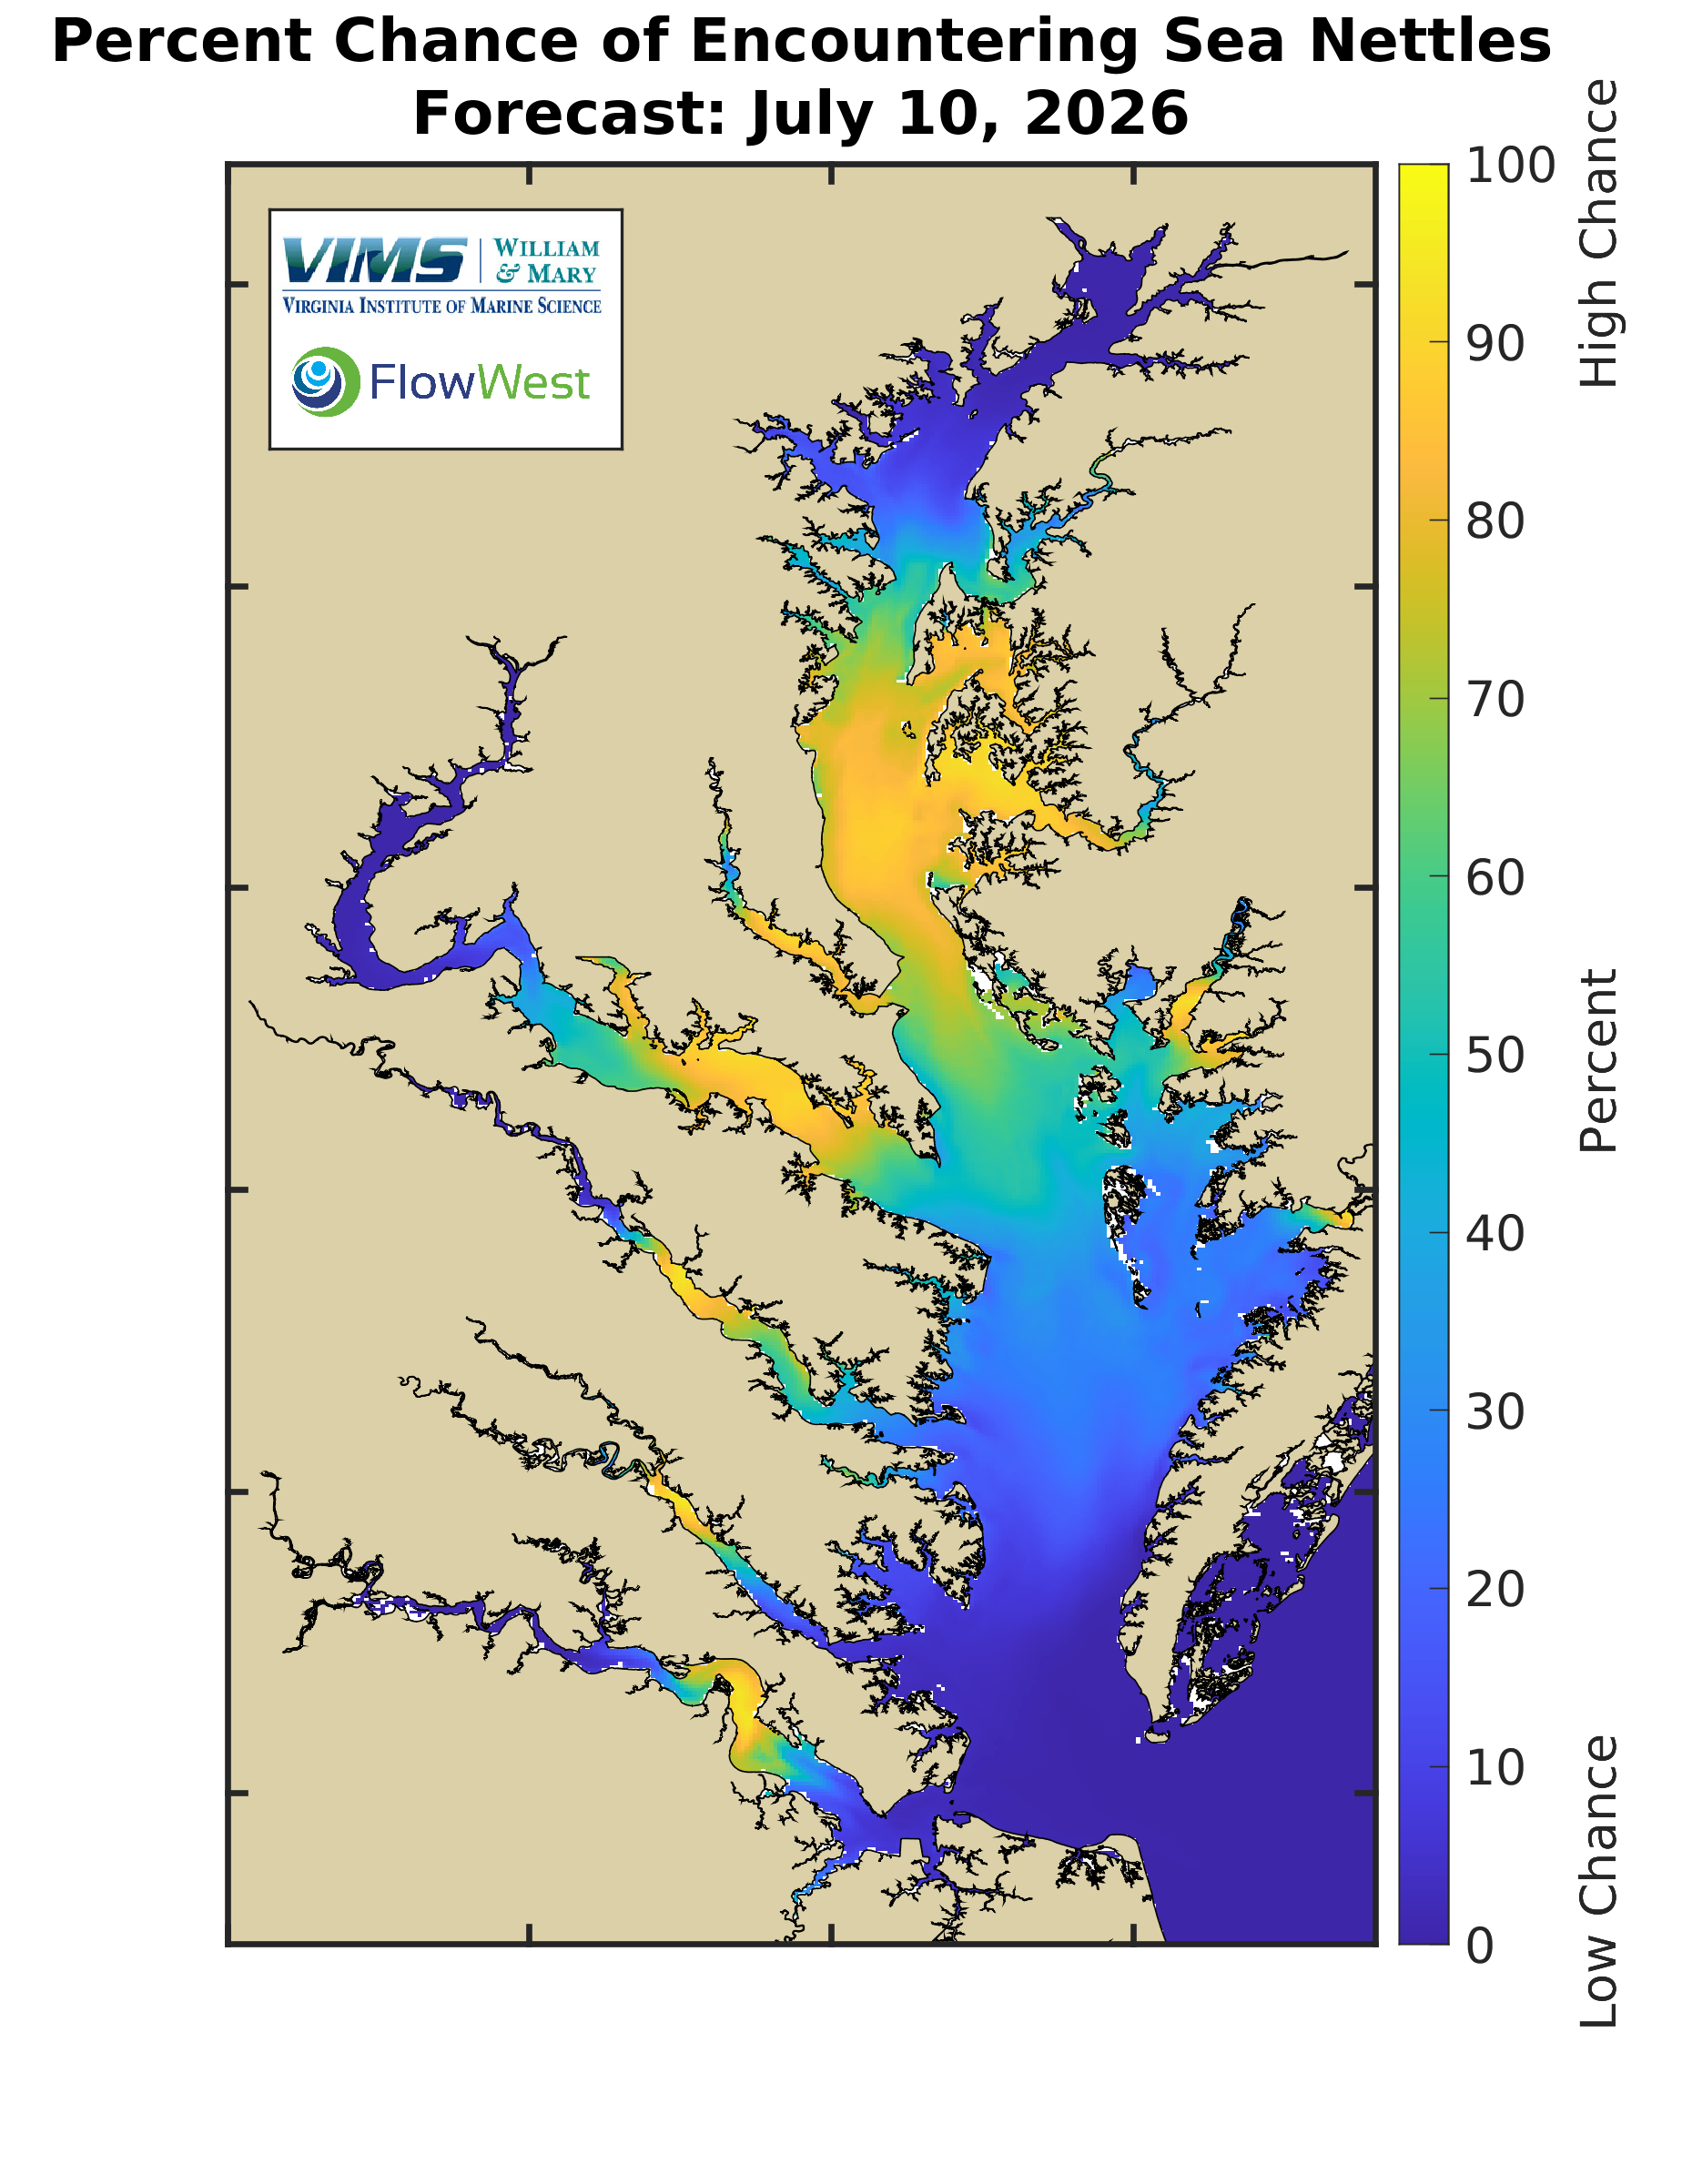
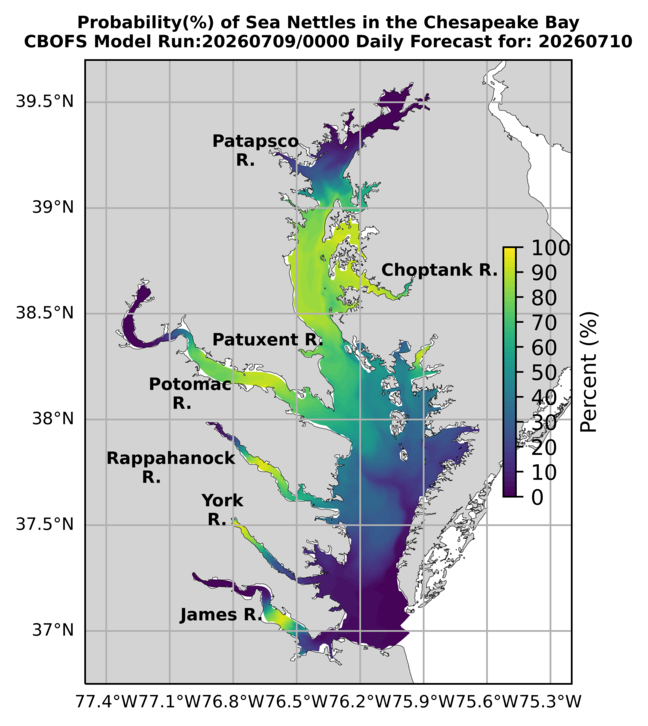
A quick tip for planning. If today reads heavy but tomorrow looks lighter at your spot, waiting a day can help. Conditions do change, and a good forecast beats guessing from the calendar alone.
What the map can't tell you
These maps are a strong planning tool, but they have limits, and we would rather be honest about them. The forecast is a model. It describes a chance from conditions like heat and salt. It cannot see the actual jellyfish that a wind shift or a tide just pushed toward the sand. You can have a low reading and still meet a nettle, or a high reading on a day the water happens to be clear at your feet.
The bay maps are also less useful on the open Atlantic. If you are headed to the oceanfront rather than the bay, the salty ocean water is different habitat, and these bay-focused maps do not cover it well. For that stretch, start with our Virginia Beach oceanfront page instead.
For a specific beach, a single map color is a rough read. Our beach pages take the guesswork out by turning the map values near each spot into a plain Light, Moderate, or Heavy label. Try the Virginia Beach jellyfish report or Colonial Beach to see how that looks. You can read exactly how we turn maps into labels on the about the data page.
Most important, the map is not a lifeguard. When you arrive, check the flags. If a beach flies a purple flag for dangerous marine life while the map reads low, believe the flag. It wins every time.
Which map is best for Virginia beaches?
For most Virginia bay and river beaches, either map works, and it is smart to glance at both. But the fastest answer is not a map at all. Our daily Virginia jellyfish report reads both maps for you and ranks every beach we track. To compare spots side by side, use the best beaches to avoid jellyfish today and worst jellyfish beaches today pages. If you do get stung, our sting first aid guide walks through the simple steps.